
We have recently streamlined how validated performance of smallcases is showcased across smallcase app, website, broker platforms and manager microsites. The improvements are aimed to bring clarity in return metrics for smallcase investors. This addresses instances where, for the same return label (6M Returns , 1Y CAGR, etc.), the performance numbers didn't match across search/discover pages and smallcase profile pages due to time period rounding.
On smallcase.com, smallcase app, and broker platforms
Search/Discover pages (all smallcases, trending lists, etc.) - exact point-to-point returns for the latest completed time period will be shown. Thus, for example,
If a smallcase is 6.5 months old, returns of the last 6 months from today will be shown.
If smallcase is 2.5 years old, CAGR of the last 2 years from today will be shown.
Sorting by 1M, 1Y and other durations continues as before.
You can refer to the below UI components to see how it looks.
Example: smallcase launched on 8 Jun 2026, standing today 19 Aug 2026.

Example: smallcase launched on 4 Aug 2025, standing today 19 Aug 2026.

Example: smallcase launched on 2 Jan 2019, standing today 19 Aug 2026.

Example: smallcase launched on 15 Jul 2022, standing today 19 Aug 2026.

smallcase profile section - Returns/CAGR since launch will be shown. The header label and value will show either “Returns” or “CAGR” based on the age of the smallcase.
smallcase age < 1 year → “Returns”
smallcase age ≥ 1 year → “CAGR”
The performance graph would continue to show all durations, and will now default to max. Returns will be inline with the headline returns for smallcases < 1 year old.
You can refer to the below UI components to see how it looks.
Example: smallcase launched on 8 Jun 2026, standing today 19 Aug 2026.

Profile Section
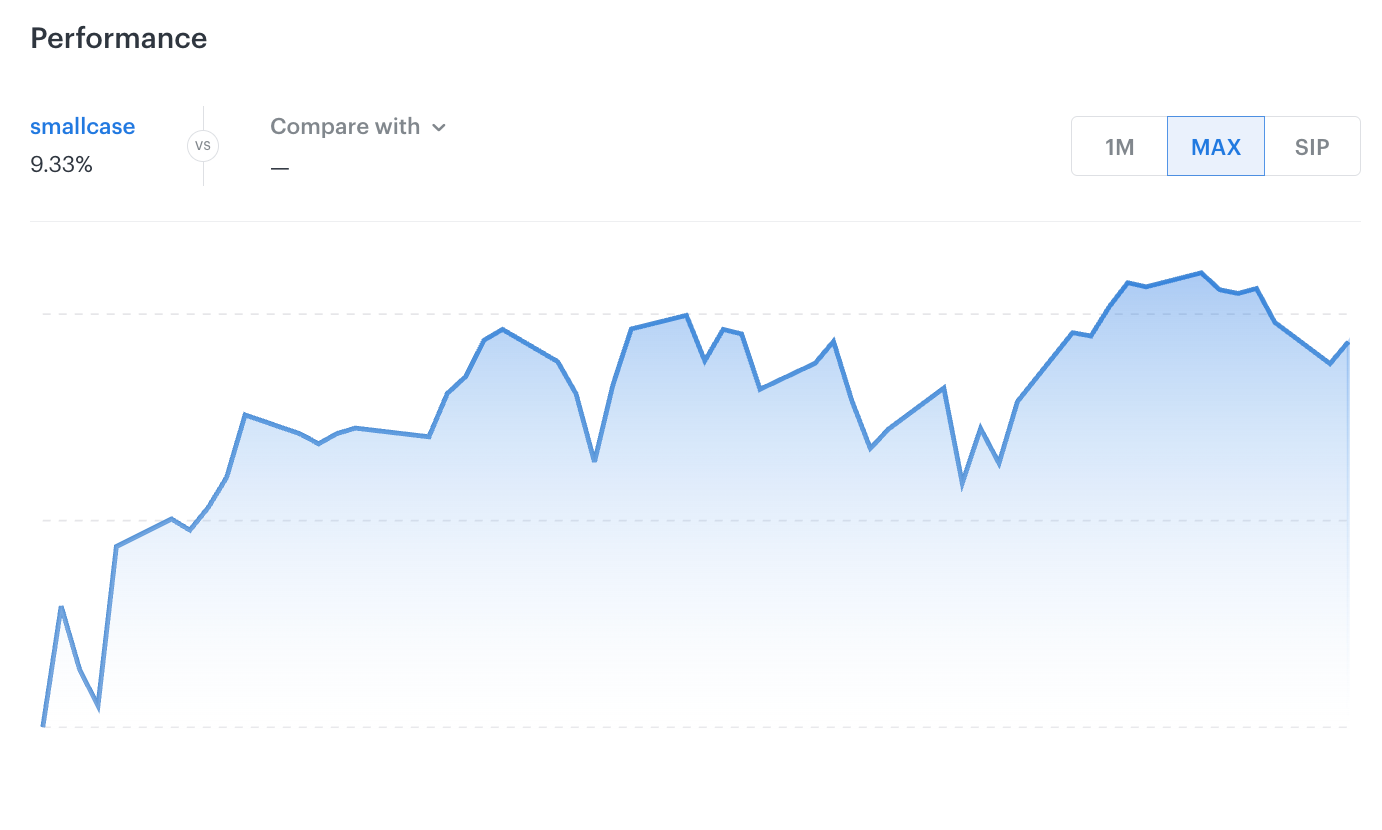
Performance Graph
Example: smallcase launched on 2 Jan 2019, standing today 19 Aug 2026.
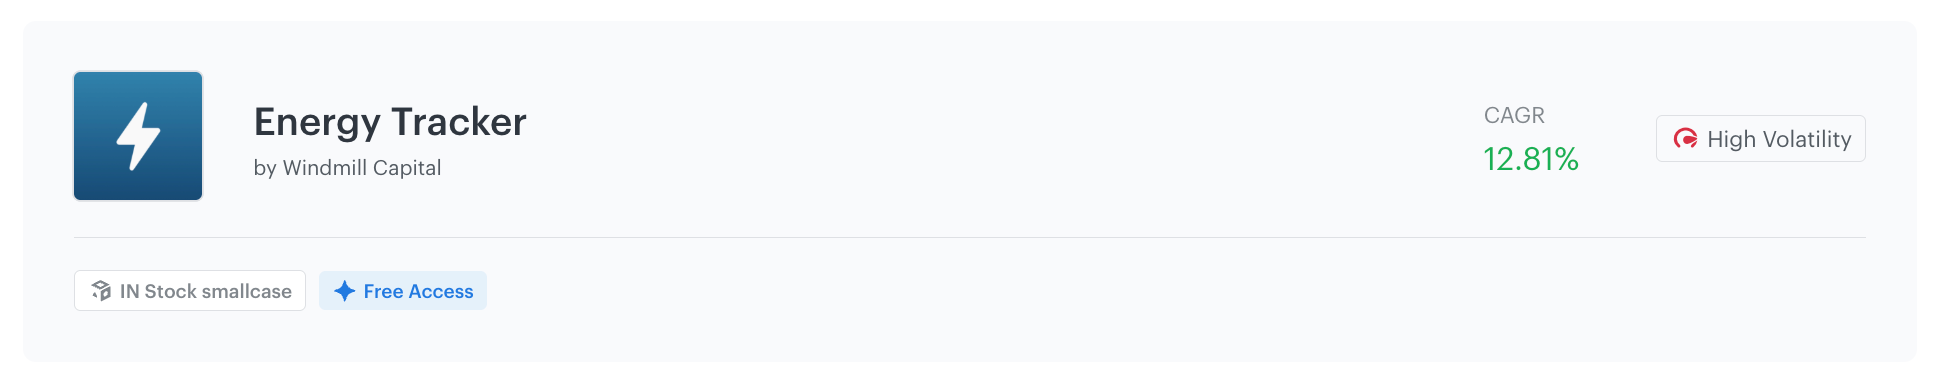
Profile Section
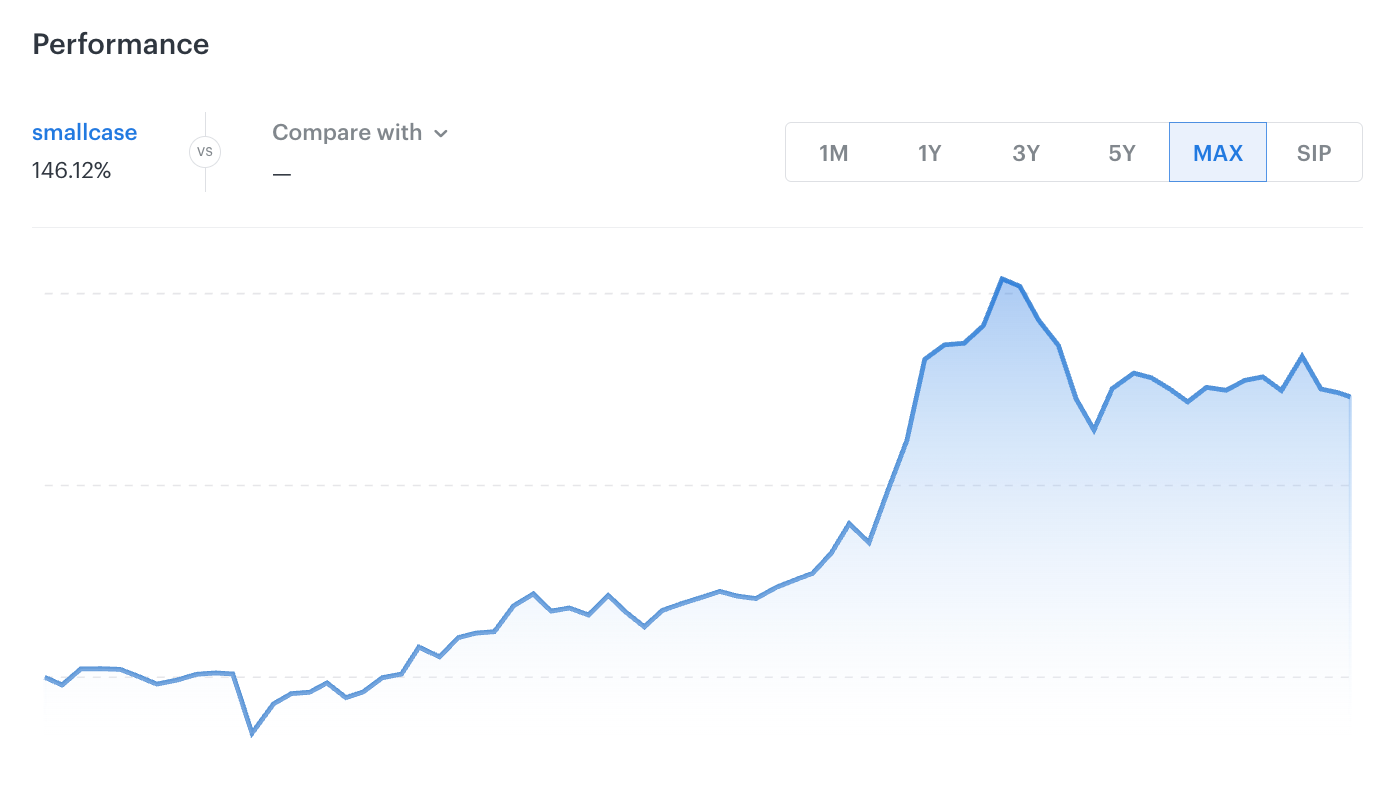
Performance Graph
On manager micro-sites
Returns/CAGR since launch will be shown on both - the landing page and the smallcase profile page.
You can refer to the below UI components to see how it looks.
Example: smallcase launched on 8 Jun 2026, standing today 19 Aug 2026.
Landing Page

Profile Section
Example: smallcase launched on 2 Jan 2019, standing today 19 Aug 2026.

Landing Page

Profile Section